
San Joaquin
San Joaquin E — 21980 Idaho
Tuesday, September 29, 2026 at 01:58 AM
This monitor is transmitting a reading that is not physically possible, which means its hardware is faulty. Its readings are hidden until it is serviced.
PM2.5 averages
| Period | PM2.5 (µg/m³) | US EPA AQI |
|---|---|---|
| 1-hour avg | 189.5 | 264 |
| 6-hour avg | 69 | 160 |
| 24-hour avg | 39.2 | 110 |
| 1-week avg | 19.1 | 70 |
Other readings
| Temperature | 68 °F |
| Humidity | 42 % |
| Pressure | 1004.1 mbar |
| PM1.0 | 2992.6 µg/m³ |
| PM10 | 2992.6 µg/m³ |
| Last reported | Sep 29, 2026 1:37 AM |
About CALs
Community Air-Quality Levels (CALs) are used to describe air quality in terms of how harmful the level of particulate matter (PM) pollution in the air is to human health. The CALs are derived using similar methods as EPA’s Air Quality Index (AQI).
You should use both IVAN Air Monitoring and government air data to understand the air quality levels around you. When comparing health recommendations from both sources, you should follow the most health protective recommendation.
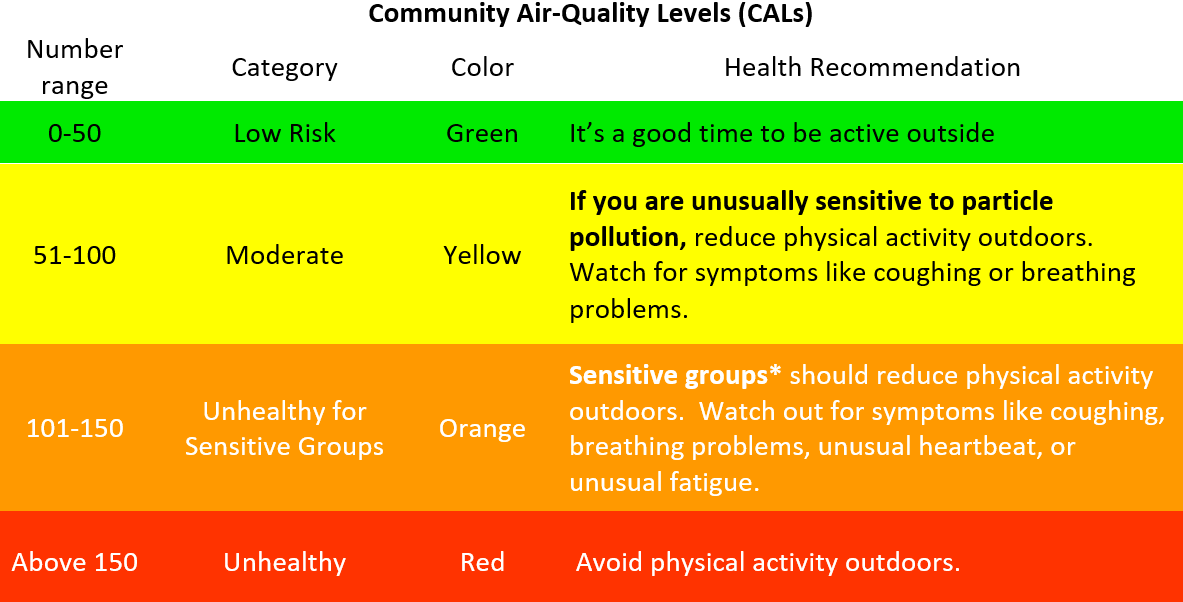
*Sensitive groups include children, teens, older adults, pregnant women, and people with heart, lung, or other chronic diseases
Disclaimer
When using this information, please note the following:
- In order to provide air quality information in real time, the data presented on this website are not validated or verified
- The air quality levels are for particulate matter (PM) only. Other air pollutants, such as ozone, may be present, even when PM levels are low.
- These data do not come from regulatory monitors and cannot be used to infer violations of the law
- Data on this website should be considered preliminary and used with discretion
Learn more about our monitor validation process, how to use the data on this website, and how to compare the data with government
More info
View the Air Monitoring Q&A for more information on the following topics: